MACD Calculation and Visualization: A Pythonic Approach
As a Python enthusiast and a trader, I’ve always been fascinated by the world of technical analysis. In my previous article, I explored the Stochastic Oscillator, a popular momentum indicator used to gauge the market’s sentiment. Today, I’ll delve into another widely used momentum oscillator: the MACD (Moving Average Convergence Divergence).
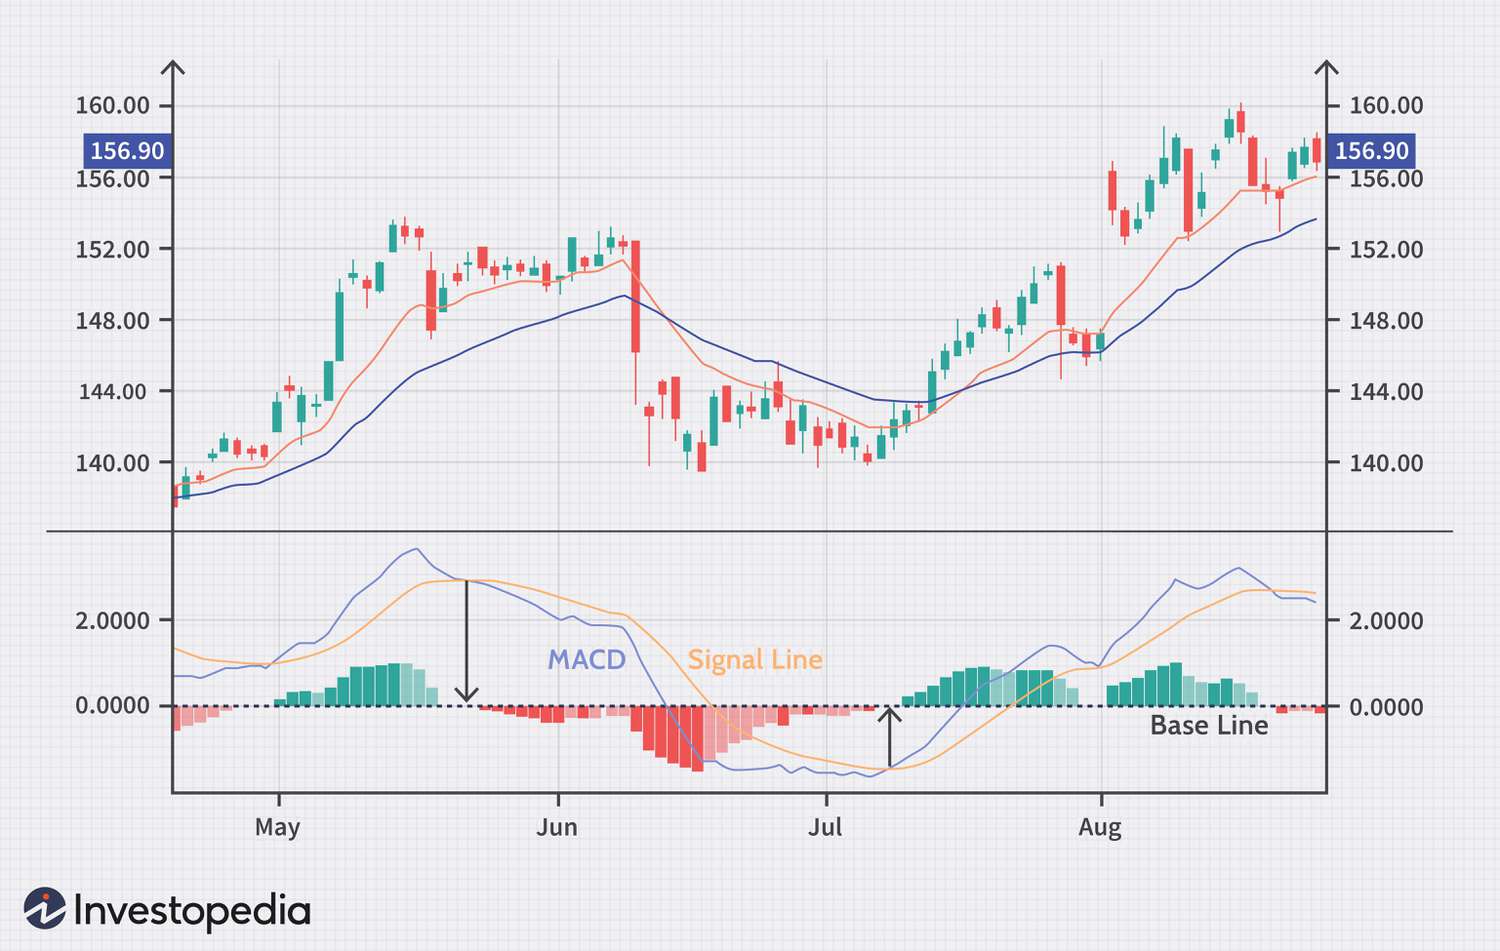
 MACD chart example
The MACD is a powerful tool for identifying trends and predicting potential reversals. It’s calculated by subtracting the 26-period exponential moving average (EMA) from the 12-period EMA. The resulting plot provides a visual representation of the relationship between these two moving averages.
To calculate the MACD using Python, we can utilize the pandas and yfinance libraries. Let’s use Tesla’s stock price as an example, just like in our previous Stochastic Oscillator example.
import pandas as pd
import yfinance as yf

# Download Tesla's stock price data
data = yf.download('TSLA', start='2020-01-01', end='2022-02-26')

# Calculate the MACD
data['EMA_12'] = data['Close'].ewm(span=12, adjust=False).mean()
data['EMA_26'] = data['Close'].ewm(span=26, adjust=False).mean()
data['MACD'] = data['EMA_12'] - data['EMA_26']

# Plot the MACD chart
import matplotlib.pyplot as plt

plt.plot(data['MACD'])
plt.title('MACD Chart')
plt.xlabel('Date')
plt.ylabel('MACD Value')
plt.show()
MACD calculation example
As we can see, the MACD provides a clear visual representation of the relationship between the two moving averages. This can be a valuable tool for traders and analysts looking to identify trends and predict potential reversals.
“The MACD is a powerful tool for identifying trends and predicting potential reversals.” - Me
In conclusion, the MACD is a valuable addition to any trader’s toolkit. By combining Python’s data manipulation capabilities with the MACD’s trend-identifying prowess, we can create a powerful system for analyzing and predicting market trends.
 Python logo
As a Python enthusiast, I’m excited to explore more technical indicators and trading strategies using Python. Stay tuned for more articles on this topic!


