Unlocking Earnings Insights with Python
In the fast-paced world of finance and investing, staying ahead of the curve requires access to reliable and timely information. Earnings calls, where companies discuss their financial performance and future prospects, provide valuable insights for investors. However, sifting through lengthy transcripts can be time-consuming and challenging. This is where the Financial Modeling Prep (FMP) earnings transcripts endpoint comes in handy.
 Financial Modeling Prep (FMP) earnings transcripts endpoint
Understanding the Flesch Reading Ease Score
The Flesch Reading Ease score is a widely used readability metric that assesses the ease of understanding a piece of text. It was developed by Rudolf Flesch, an author and readability expert, in the 1940s. The score is based on two main factors: the average sentence length and the average number of syllables per word.
“The Flesch Reading Ease score is a widely used readability metric that assesses the ease of understanding a piece of text.” - Rudolf Flesch
Python Implementation
Step 1: Set up the Environment
To get started, make sure you have Python installed on your system. We will be using the following libraries: requests, pandas, textstat, matplotlib, and seaborn.
Step 2: Retrieve Earnings Transcripts
We will use the FMP earnings transcripts endpoint to retrieve the transcripts for Apple Inc. (AAPL) for specific years and quarters.
Step 3: Calculate Readability Scores
Now that we have the transcripts, let’s calculate the Flesch Reading Ease scores using the textstat library.
Step 4: Retrieve Stock Prices and Calculate Returns
To analyze the relationship between the readability of earnings calls and stock performance, we need to retrieve the stock prices for Apple Inc. (AAPL). We will use the FMP stock price endpoint to fetch the adjusted closing prices and calculate the 5-day returns following each earnings call date.
Step 5: Combine Readability Scores and Stock Returns
We will combine the readability scores and stock returns into a single DataFrame called combined_df for further analysis and visualization.
Step 6: Visualize the Relationship
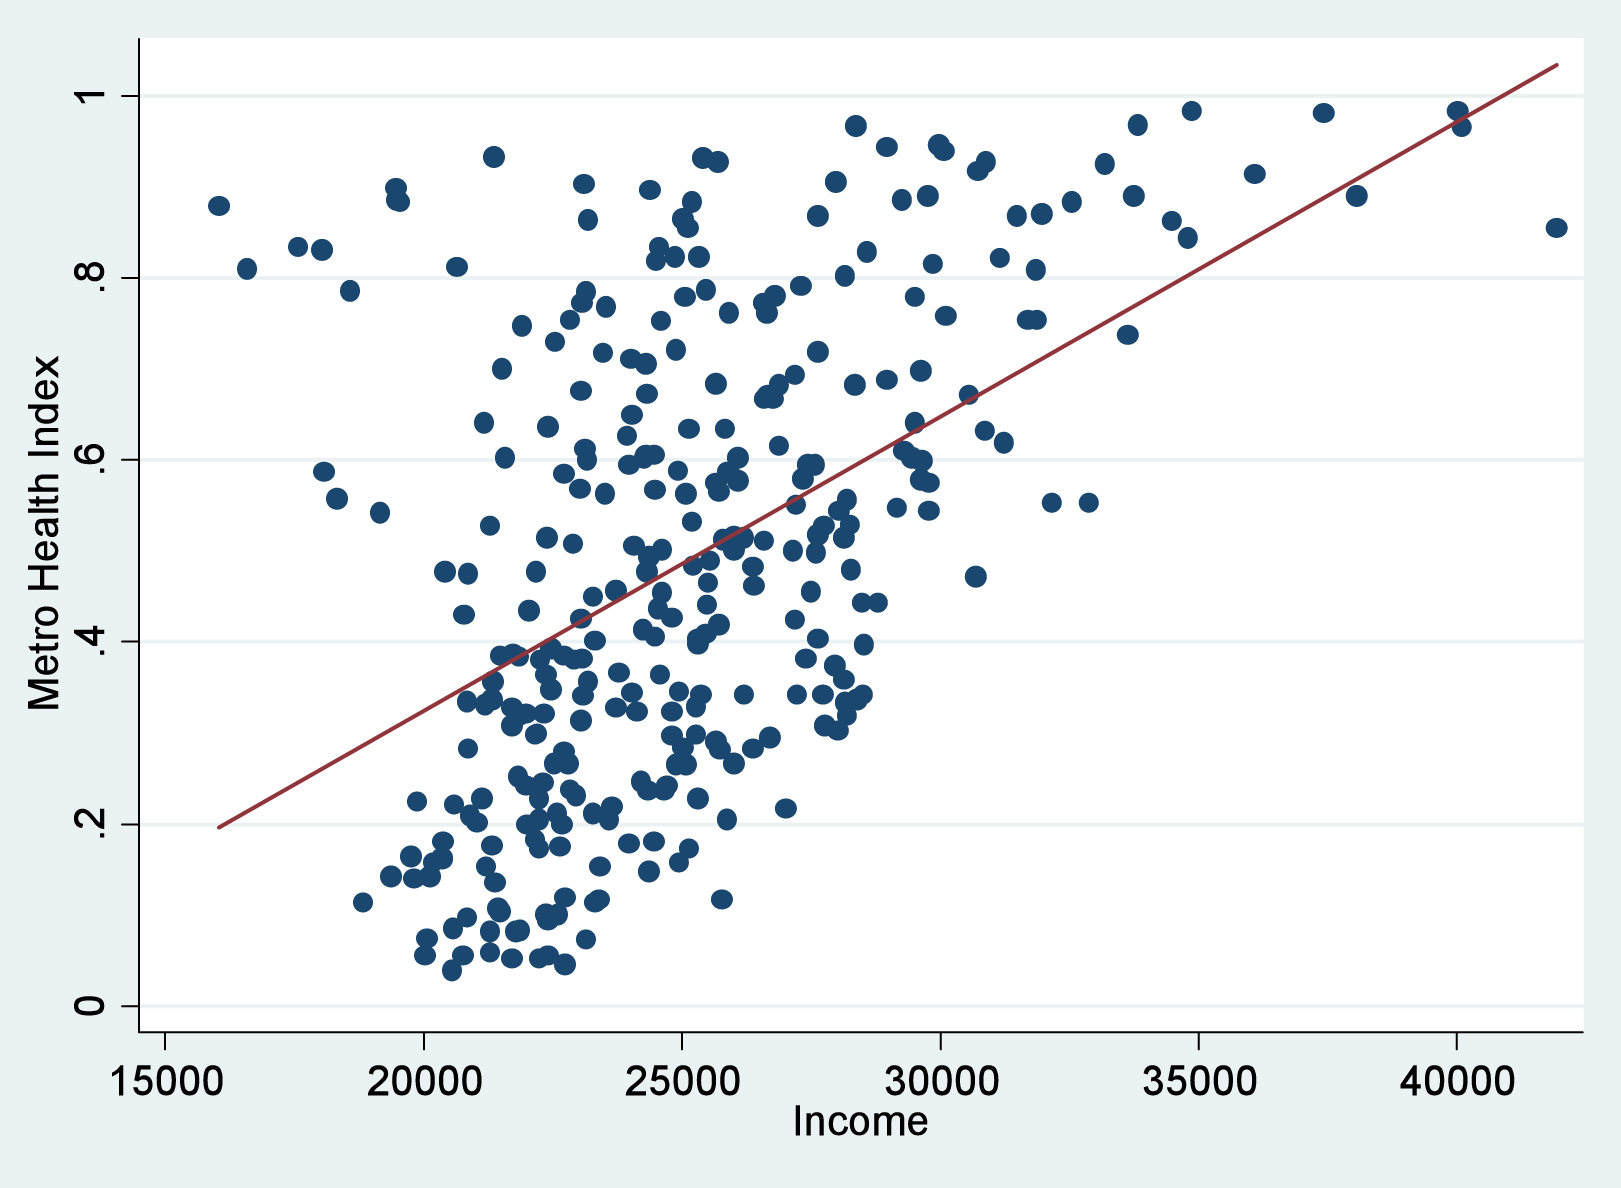
Finally, we will create a scatter plot to visualize the relationship between the readability scores and the 5-day returns.
 Scatter plot of readability scores and 5-day returns
Conclusion
In this article, we explored how to use the FMP earnings transcripts endpoint to analyze the readability of earnings calls for Apple Inc. (AAPL) over multiple years and quarters. By leveraging Python and the textstat library, we calculated the Flesch Reading Ease scores and compared them to the 5-day stock returns following each earnings call.
 Apple Inc. Logo


